-
Create and Format Tables
Create Excel Tables from Cell Ranges
Creating a table in Excel is a breeze, and it helps transform a simple range of data into a powerful tool for analysis and reporting. Ready to elevate your data game?
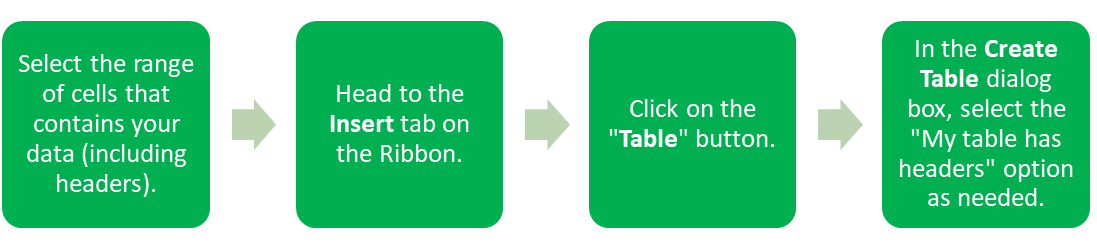
Congratulations! You’ve just turned your cell range into a table. You’ll notice that your data is now more manageable, with built-in sorting and filtering options.
Apply Table Styles
Now that you have a table, let’s make it visually appealing! Excel offers various table styles that allow you to apply quick formatting to your table, making it stand out.
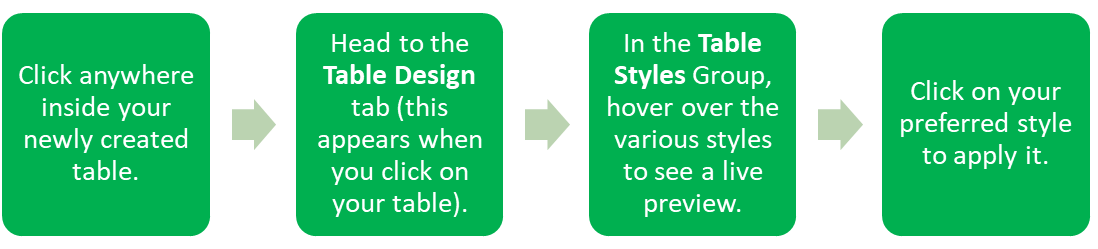
With just a few clicks, your table will shine, making it easier to read and understand at a glance!

Watch: Apply styles in Excel
Watch the below video for a demonstration on how to apply styles in Excel.
-
Modify Tables
Once you’ve created your table, it’s time to tailor it to fit your needs. Let’s explore how to modify your tables to keep your data organised and relevant!
Add or Remove Table Rows and Columns
As your data grows, you might need to add more rows or columns to your table. Fortunately, Excel makes this simple!
How to Add Rows or Columns:
To Add Rows: Click on the last cell in the last row of your table and press the “Tab” key on your keyboard. A new row will magically appear!
To Add Columns: Right-click on the header of the column next to where you want the new column to appear, select “Insert,” and choose either “Table Columns to the Left” or “Table Columns to the Right“.
How to Remove Rows or Columns:
Select the row or column you wish to remove.
Right-click and choose “Delete” or “Delete Table Rows” / “Delete Table Columns“.
Your table will adjust automatically, keeping everything neat and tidy.
Configure Table Style Options
Excel allows you to configure specific style options for your table, making it even more functional and appealing.
How to Configure Table Style Options:
- Click anywhere in your table.
- Navigate to the Table Design tab.
- In the Table Style Options Group, you’ll find various checkboxes like “Header Row,” “Total Row,” “Banded Rows,” and more. Check or uncheck these options based on your preferences.
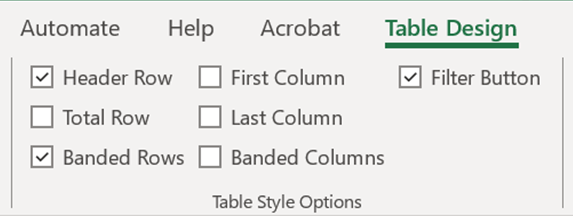
These options help enhance readability and give you greater control over how your data is presented.
Insert and Configure Total Rows
Adding a total row to your table is a fantastic way to summarise your data quickly. You can perform calculations like sums, averages, and counts directly within your table.
How to Insert a Total Row:
- Click anywhere in your table.
- Head to the Table Design tab.
- In the Table Style Options Group, check the box for “Total Row.”
A new row will appear at the bottom of your table, allowing you to select a summary function for each column. Simply click on the cell in the Total Row, and a drop-down menu will let you choose your desired calculation.
-
Filter and Sort Table Data
Watch: How to Sort (and Unsort) Data in Excel
Once your data is neatly organised in a table, you’ll want to filter and sort it to find the information you need quickly. Let’s dive into how to do that!
Filter Records
Let’s say you’re planning an event, and you have a guest list with details like names, dietary preferences, and RSVPs. You could use filtering in Excel to quickly find out who has specific needs, like vegetarian and gluten free, so you can plan your menu accordingly!
Filtering allows you to display only the data that meets certain criteria, making it easy to focus on specific information.
How to Filter Records:
- Click on the drop-down arrow in the header of the column you want to filter.
- Choose the criteria you want to filter by (e.g., select specific values or set conditions).
- Click “OK“.
Your table will now only show the records that meet the criteria, helping you zero in on the data that matters most!
Sort Data by Multiple Columns
Sorting your table data can help you gain insights at a glance. Excel allows you to sort by multiple columns, making it easy to organise your data in a meaningful way.
How to Sort Data by Multiple Columns:
- Click on the drop-down arrow in the header of the first column you want to sort.
- Select “Sort A to Z” or “Sort Z to A” for the first sort level.
- To add more sorting levels, go to the Data tab on the Ribbon and click on “Sort.“
- In the Sort dialog box, add levels by selecting additional columns and the sort order.
By sorting your data, you’ll create a clearer picture of trends and patterns, making your analysis more effective.
-
Try it Yourself
You're making brilliant progress through this Self Study Pack!
Make sure to do the tasks below so you can finish this topic.
Below is the next workbook for you to use while you complete your tasks.
Download: 3. Manage Tables and Table Data

Apply Your Thinking
Complete the tasks below.
- Create a Table: Select the range of data provided in the “UserData” worksheet, including headers. Create a table and ensure the “My table has headers” option is checked.
- Apply Table Styles: Click inside your table and apply the “Table Style Light 13” from the Table Design tab.
- Add a New User: In the “UserData” worksheet, add a new row at the bottom of the table. Fill in the new user data as follows: User Id: 1A2B3C, First Name: John, Last Name: Doe, Sex: Male, Email: john.doe@example.com, Phone: 123-456-7890, Age: 34, Job Title: Software Developer.
- Insert a New Column: In the same worksheet, insert a new column to the right of the “Phone” column to record the “Address” of each user.
- Remove a User: Select the first user row (row 2) in the “UserData” worksheet and delete it.
- Insert Some Stats: In the “UserData” worksheet, in cell D109, enter the count of User Ids by using an appropriate. In cell D111, calculate the average age of the users by entering the appropriate formula.
- Filter by Gender: In the “UserData” worksheet, filter the table to show only female users.
- Sort Data by Last Name: In the “SortData” worksheet, sort the table data by Last Name in ascending order.
- Display Formulas in Age Column: In the “UserData” worksheet, change the display settings to show the formula in the “Age” column instead of the calculated age values.
You can use the file below to access solutions to these tasks.
